Looker JOIN 2019
JOIN is Looker’s annual user conference. It’s a three-day event of user presentations, presentations by Looker employees, hands-on workshops, networking events, and a vendor fair. You know, conference stuff. This year, I attended as an invited presenter in the workshop section. Here are my highlights.
My workshop on data documentation
 The Hands-On Labs were a series on 45 minute workshops with limited seats. Attendees were expected to have their own laptops and were guided through an exercise. I hosted a lab on building data documentation around the Looker API, in partnership with an engineer from Looker. We ran the workshop on both days of the conference and both offerings were at capacity.
The workshop went well. There were really two parts: the Looker API part lead by Leigha Jarrett and the documentation part lead by me. Looker had created a sandboxed Looker instance with fake data for the workshops and Leigha set up a Python notebook to hit the API and pull out lookML info. Then, after we showed folks how to get lookML data represented as a data frame in Python, I talked about how I do that to build the Data Hub using R, blogdown, and Hugo. I talked about the value in creating a documentation page—basically and About Me—for each Explore and how we’ve been (slowly) building this out at Amplify.
The presentations are in this Looker repo: https://github.com/llooker/join2019_labs
Looker 7
Looker announced version 7 and gave a presentation during the Thursday opening keynote on some of the new features. I walk through what I found to be the most interesting below. I’ll update this with video links to the keynote as they become available. Announcement here:
https://looker.com/news/press/looker-announces-looker-7
Dashboard Filters
All dashboard filters are currently text fields with dropdown suggests. They work exactly like filters in Explore and are generally too complicated. The new filters add some much needed simplicity: buttons, popup calendars for range selection, sliders, and possibly some other stuff.
Custom Dashboard Styles
They are finally adding a style editing menu that will allow you to customize spacing, fonts, colors, and more. These seem common sense, obvious, and very very useful.
Some of these new dashboard features are shown in this Looker blog post https://looker.com/blog/empowering-developers-to-create-powerful-custom-data-experiences
Text Styling
Distinct from dashboard-wide styling, Looker overlords are finally giving us the ability to change things like font size on text tiles. The future is upon us, people.
Cross Filtering
Select a range of dates in one tile, and get updated aggregates in some other tiles. For reference, this is similar functionality as provided by the crosstalk package for htmlwidgets in R.
New Export Integrations
Not much detail here, but there will be a new Google Drive export integration. Send query results into a google sheet maybe? Or will it just be: upload a PDF of a dashboard to Drive? It’s probably that. Let’s wait and see!
Connections
There’s a new “Connections” feature that seems tied to the data blocks. They claim it provides easy, push-button integration with various SaaS tools.
Security Certifications in GCP
They highlighted new security certs on their hosted solution, including ISO 27001, PCI, and SOC 2 Type I (on Google Cloud Platform) certifications, in addition to maintaining its SOC 2 Type II (AWS) and HIPAA Security Rule mapping.
Marketplace
This is a new service to discover and install add-ons. To whit, Marketplace “contains an ever growing collection of applications, integrations, plug-ins, templates, data sources and custom visualizations built by the Looker developer ecosystem.”
Dynamic Dashboard
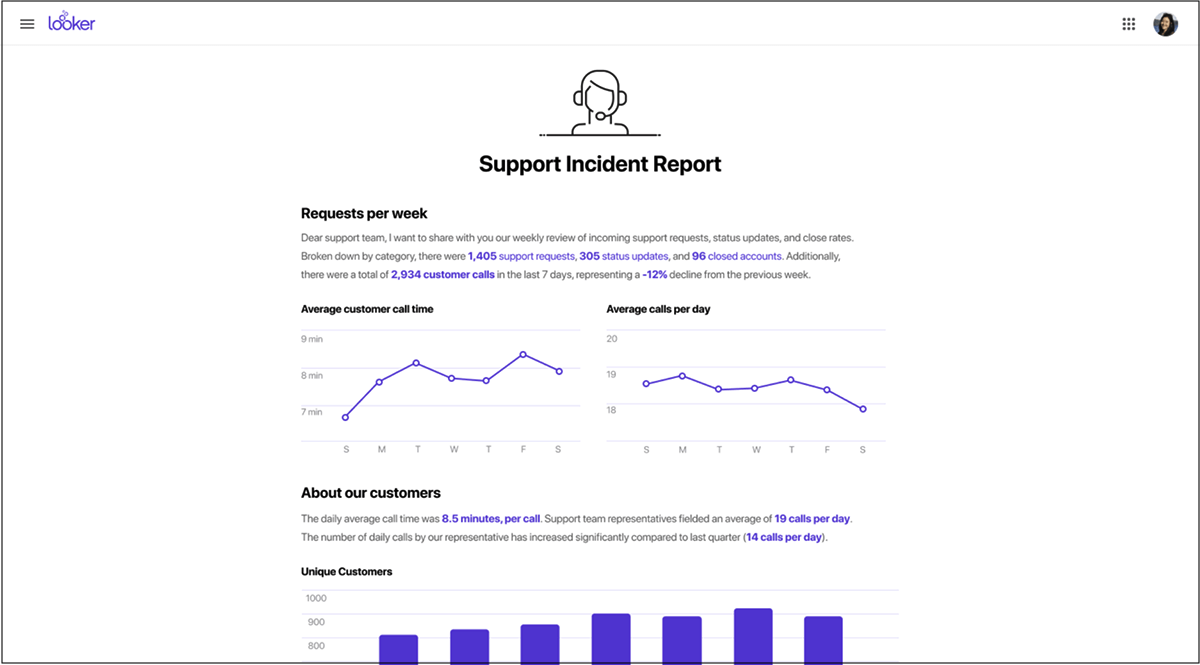
This is the thing I am personally most excited about. There’s not much information about it yet but it’s a different take on reporting than “dashboards”. It’s more like the output of R or Python notebooks: narrative text, with embedded dynamic text, interwoven with visuals. The gloss of literate programming brought to BI. More of a document than a dashboard. I love it. Where the constraints of a text tile in a dashboard are too limiting, this frees up the whole page and elevates text to be an equal part of the experience as the visuals. I’m really excited about the possibilities for reporting with the new dynamic dashboards. Screenshot below. What a lovely document.
Other Stuff
There’s more that they covered—including new SDKs—that I haven’t mentioned. Hopefully they release video of the announcement keynote soon.
Presentations
I went to a few of the talks, which were wildly variable in quality. Here I’ll highlight a couple of the ones I found useful. I expect the videos to be upload to Looker’s YouTube channel soon.
The full agenda is here: https://looker.com/events/join-2019/agenda
Open Source Tools
There’s a growing set of open source tools for working with Looker and LookML, including linters, parsers, generators, and more. This talk walked through the landscape, and is also presented as a blog post.
Perhaps the most interesting development here is the open source toolkit from WW, called lookml-tools
https://github.com/ww-tech/lookml-tools
Testing
I actually missed this talk because the room was full and overflowing into the hallway, so I couldn’t see or hear anything. Will update with a link to the presentation if they make the video available, but this was the MilkBar guy. This was about Looker’s new Data Tests and the spectacles tool: https://spectacles.dev/
Data Ambassadors: Creating Data Driven Taskforces
Many of the talks touched on the topic of training and empowering non-power users but this was a detailed case study at one organization. I call it out here because I found the talk inspiring for how to formalize a task force or ambassador program—sort of a “data deputy” program made proactive and focused on a train-the-trainer model. At Amplify, we’ve been tossing around a few related ideas and I found this inspiring for how much more we can be doing.
Closing Thoughts
All in all, a decent conference. There were lots of networking opportunities and a vendor area to learn about other services. I had chances to catch up with the NY meetup folks (Jia, Carl Anderson, and some others), our Looker reps, and met some new friends along the way. Who knew how dope financial services were. 😉
I’ll add that the whole experience was enhanced by being a presenter. Awareness of new developments is easy enough to get from social media and the Looker discourse site, but it was great to meet other presenters and extend my network of people who are building tools around Looker and who are building new data governance models. I had several follow-up one-on-one conversations with attendees of my Hands-on Lab and expect to stay in touch with them as we continue the conversation. Also, they served It’s It ice cream sandwiches during one of the coffee breaks, and that’s literally the best ice cream sandwich. It was all worth it.
— Samuel